icon/x Created with Sketch.

Splunk Cookie Policy

We use our own and third-party cookies to provide you with a great online experience. We also use these cookies to improve our products and services, support our marketing campaigns, and advertise to you on our website and other websites. Some cookies may continue to collect information after you have left our website. Learn more (including how to update your settings) here.
Accept Cookie Policy

Classic Splunkbase is heading into retirement…

Splunkbase Classic has been deprecated and will be deactivated on February 18, 2026.
The new version of Splunkbase introduces improved search and discoverability, faster performance, enhanced accessibility, and a modern interface. Start exploring the new experience today!
Splunkbase Classic has been deprecated and will be deactivated on February 18, 2026. Go to new Splunkbase.

Accept License Agreements

This app is provided by a third party and your right to use the app is in accordance with the license provided by that third-party licensor. Splunk is not responsible for any third-party apps and does not provide any warranty or support. If you have any questions, complaints or claims with respect to this app, please contact the licensor directly.

Thank You

Downloading Trellix ePO All in one
SHA256 checksum (trellix-epo-all-in-one_122.tgz) 2f7deef3007bfeebd5cf566f394f6d936d34e9eede5b8a0b5f963e2496443b14
To install your download
For instructions specific to your download, click the Details tab after closing this window.

Flag As Inappropriate

splunk

Trellix ePO All in one

Splunk Cloud
Overview
Details
The Trellix (McAfee) ePO Splunk Technology Add-on enables Splunk users to reliably collect, normalize, and analyze security telemetry from Trellix ePolicy Orchestrator (ePO) in one centralized platform. Many organizations running Trellix ePO lack a native, CIM-compliant integration with Splunk, making it difficult to correlate endpoint security data with other security and IT signals.

This app addresses that gap by providing a production-ready integration that ingests threat events, malware detections, endpoint and agent health, policy compliance, quarantine activity, updates, and user audit logs via the ePO REST API (and syslog where applicable). All data is normalized to the Splunk Common Information Model (CIM), allowing immediate use with Splunk Enterprise Security, Security Essentials, and custom SOC workflows.

By combining secure data collection, enterprise-grade reliability, and a comprehensive all-in-one security dashboard, the add-on helps SOC teams, security engineers, and Splunk administrators gain clear visibility into endpoint threats, compliance posture, and operational health—without building and maintaining custom integrations.

Note: This is a community-maintained, non-official add-on. It is not affiliated with Splunk or Trellix. "/sarat1kyan/TA-trellix-epo"

Details

The Trellix (McAfee) ePO Splunk Technology Add-on is designed to collect, normalize, and visualize endpoint security telemetry from Trellix ePolicy Orchestrator (ePO). This section explains how to use the app after installation, including configuration, daily operation, dashboards, and best practices.


How the App Works

The add-on uses Splunk modular inputs to securely connect to the Trellix ePO REST API (and optionally syslog) at scheduled intervals. Retrieved data is parsed, enriched, and normalized to the Splunk Common Information Model (CIM), making it immediately usable for:

  • Splunk Enterprise Security
  • Security Essentials
  • Custom correlation searches
  • SOC dashboards and reporting

Initial Usage Workflow

  1. Install the app and complete the Setup page.
  2. Create and enable one or more Trellix ePO Inputs.
  3. Verify that data is being indexed.
  4. Use the built-in dashboards or create your own searches and alerts.
  5. (Optional) Integrate with Splunk Enterprise Security for advanced detections.

Configuring and Using Inputs

Creating Inputs

  1. Go to Settings → Data Inputs → Trellix ePO Input.
  2. Click New.
  3. Provide a unique Input Name.
  4. Select the Data Source Type.
  5. Configure polling interval, index, and batch size.
  6. Save and enable the input.

Supported Data Sources and Usage

Threat Events

  • Near–real-time visibility into detected threats
  • Used for SOC triage, alerts, and correlation
  • CIM model: Intrusion_Detection

Example search:

index=security sourcetype=trellix_epo:threat_events
| stats count by severity, threatName

Malware Detections

  • Detailed malware detection and file context
  • Supports hash-based IOC analysis
  • CIM model: Malware

Example search:

index=security sourcetype=trellix_epo:malware_detections
| stats count by malwareName, host

Host Status

  • Endpoint inventory and health visibility
  • Useful for asset management and hygiene checks
  • CIM model: Endpoint

Example search:

index=security sourcetype=trellix_epo:host_status
| stats latest(datVersion) by host

Agent Status

  • Monitor agent connectivity and health
  • Identify offline or outdated agents
  • CIM model: Endpoint

Policy Compliance

  • Track policy violations and compliance state
  • Useful for audits and security posture reviews
  • CIM model: Change

Quarantine Events

  • Visibility into quarantined files and actions
  • Supports incident investigation workflows
  • CIM model: Malware

Updates

  • DAT and engine version tracking
  • Identify outdated or failing endpoints
  • CIM model: Endpoint

User Actions

  • Audit trail of administrative and user actions
  • Supports security auditing and investigations
  • CIM model: Audit

Dashboards

Trellix ePO Security Overview (REST API)

This is the primary dashboard for data collected via the REST API.

Key Use Cases

  • SOC monitoring and daily review
  • Threat trend analysis
  • Endpoint health and coverage checks
  • Compliance and audit reporting

Main Sections

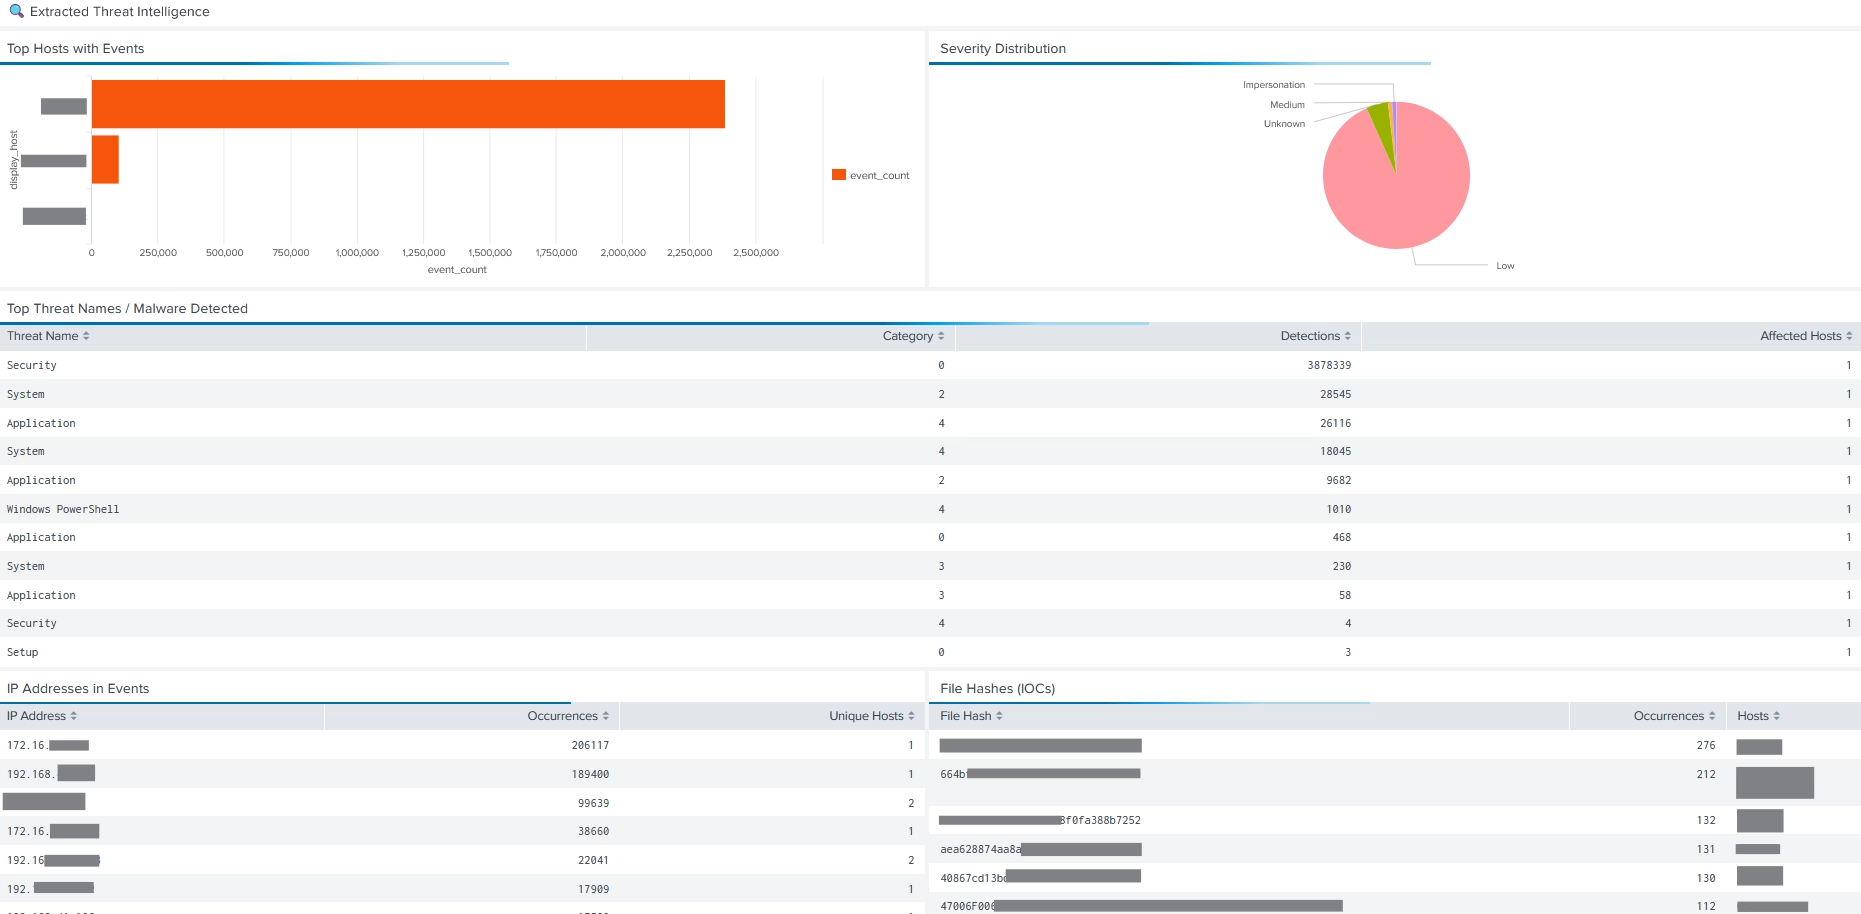
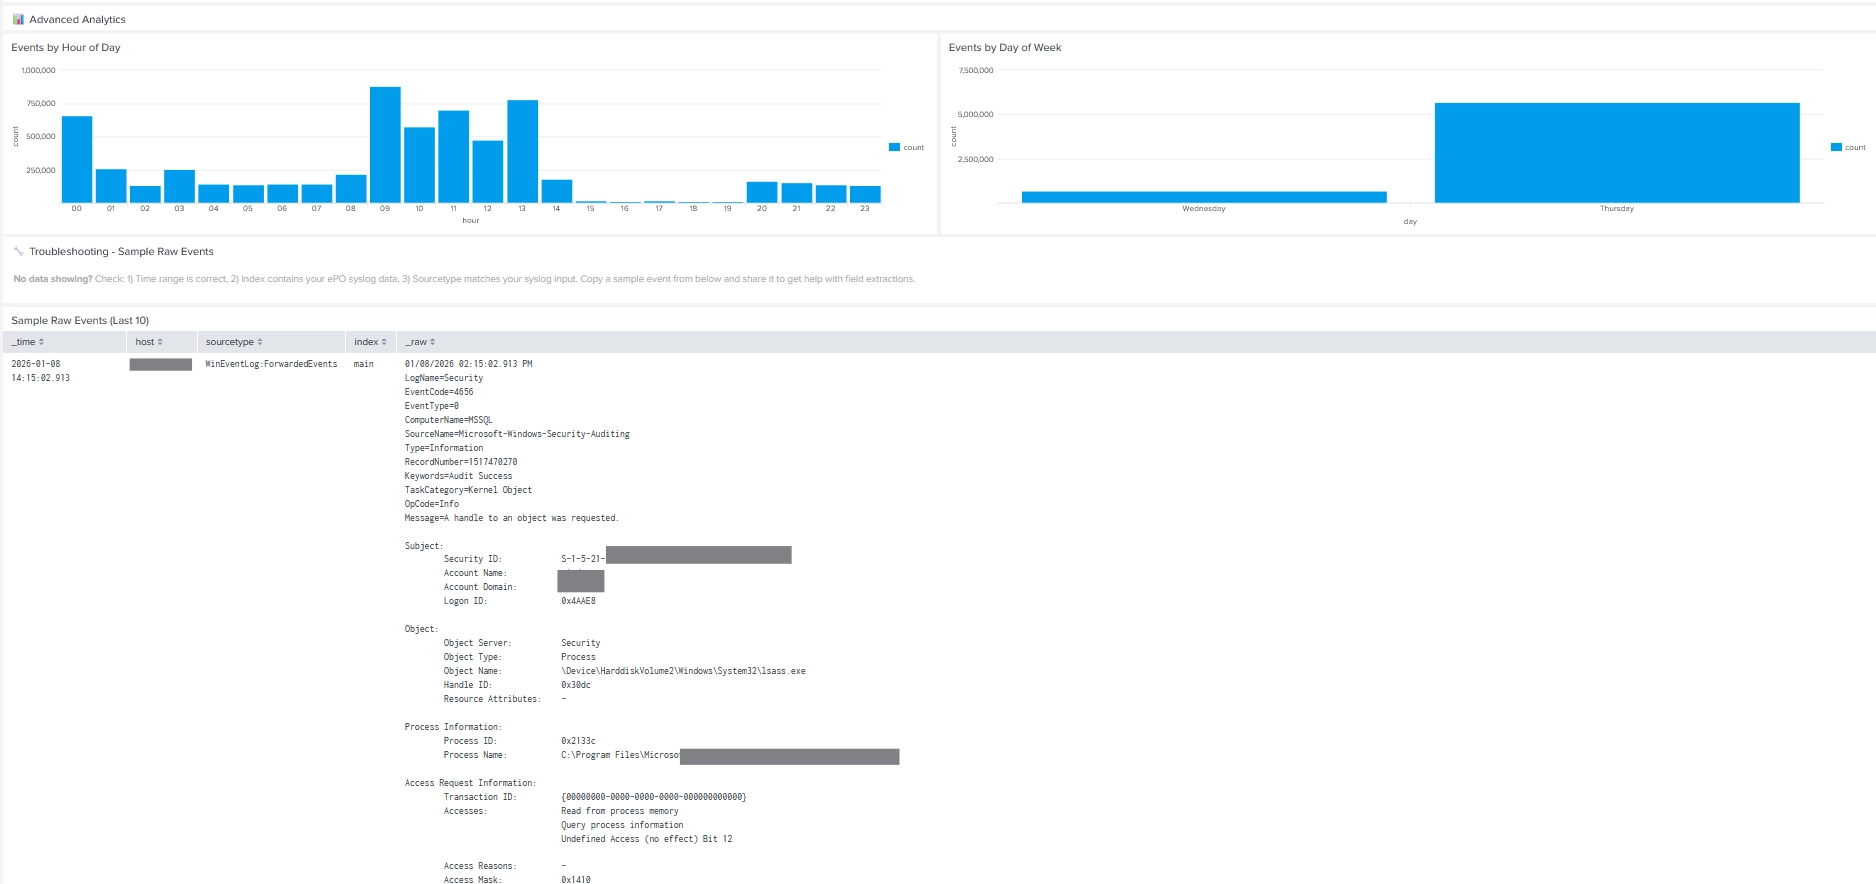
  • Security overview and threat trends
  • Endpoint and agent health
  • Threat intelligence and IOC analysis
  • Policy compliance status
  • User activity and audit actions

How to Use

  • Apply global filters (time range, host, severity)
  • Drill down into panels to investigate incidents
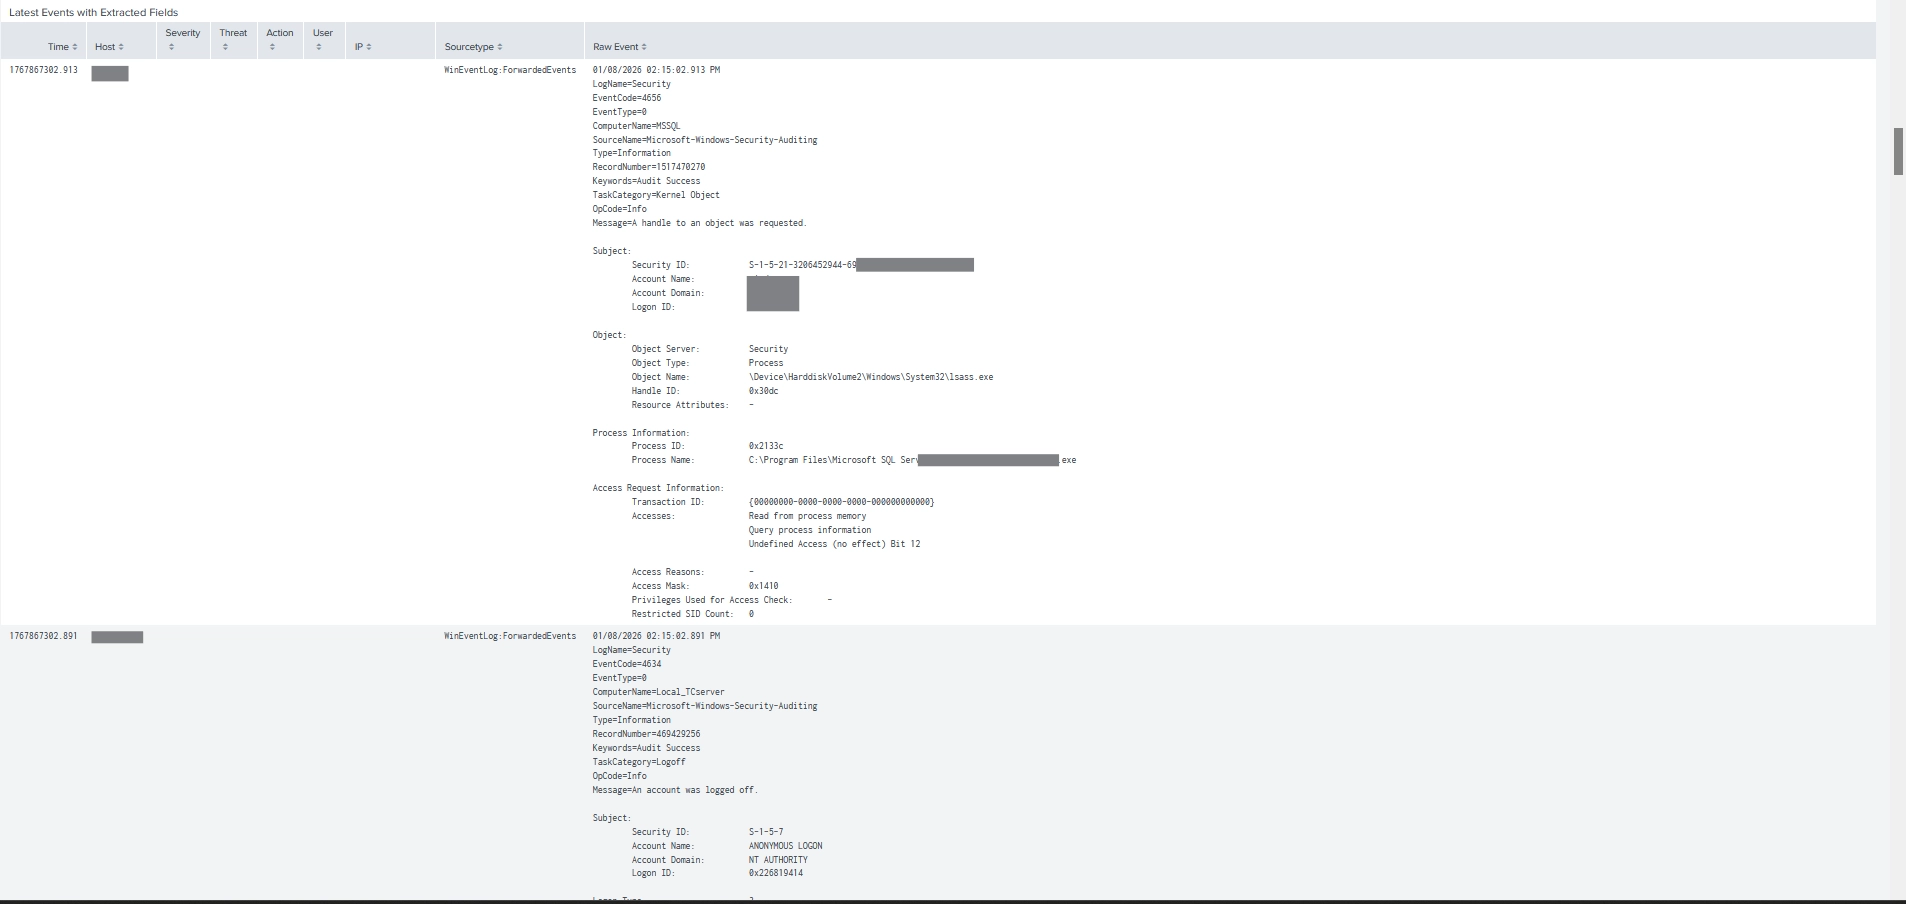
  • Pivot from dashboards to raw events

Trellix ePO Syslog Threat Events Dashboard

This dashboard is intended for environments where ePO sends threat events via syslog.

Key Use Cases

  • Analyze syslog-based threat events
  • Correlate syslog data with REST API data
  • Investigate IOC activity from logs

Usage Notes

  • Configure the correct syslog sourcetype
  • Use dashboard filters to refine searches
  • Review raw syslog messages for validation

Working with CIM and Enterprise Security

Because all supported data sources are CIM-normalized:

  • Data automatically appears in Splunk Enterprise Security dashboards
  • You can build correlation searches without custom field mapping
  • Risk-based alerting (RBA) can be applied to Trellix events

Example CIM-based search:

| datamodel Malware search
| stats count by malware_name, dest_host

Alerts and Correlation Searches

Common alert use cases include:

  • High-severity malware detections
  • Repeated infections on the same host
  • Agents offline for extended periods
  • Policy violations exceeding thresholds
  • Suspicious administrative activity

Example alert search:

index=security sourcetype=trellix_epo:threat_events severity=High
| stats count by host, threatName

Best Practices

  • Use incremental collection to avoid duplicates.
  • Separate high-volume and low-volume inputs.
  • Use a dedicated security index.
  • Align polling intervals with operational needs.
  • Regularly review dashboards and alerts.
  • Keep CIM and the add-on updated.

Typical User Roles

  • SOC Analysts: Monitor threats, investigate incidents, review dashboards.
  • Security Engineers: Tune inputs, dashboards, and alerts.
  • Splunk Administrators: Manage performance, indexes, and upgrades.
  • Compliance Teams: Review policy and audit data.

Upgrade and Maintenance

  • Disable inputs before upgrading.
  • Upgrade the app via Splunkbase or manual install.
  • Restart Splunk after upgrades.
  • Re-enable inputs and validate data ingestion.

Notes and Limitations

  • This is a non-official, community-maintained add-on.
  • API availability and fields depend on ePO version and configuration.
  • Very large environments may require tuning of intervals and batch sizes.

By following these usage instructions, users can quickly operationalize Trellix ePO data in Splunk for monitoring, investigation, compliance, and security analytics.

Release Notes

Version 1.2.2
Jan. 16, 2026

TA-Trellix-EPO Add-on
Release Notes – Version 1.2.2

Release Date: 2026-01-16

Version 1.2.2 focuses on dashboard accuracy, usability, and API reliability. This release corrects multiple dashboard query issues, improves executive visibility, and introduces a critical fix to the Trellix ePO authentication method to prevent intermittent authorization failures.

🔄 Changed
Dashboard Improvements

Switched dashboard theme from dark to light for improved readability and accessibility

Reorganized the Executive Summary to display only metrics backed by actual ingested data:

Total Managed Endpoints

Windows Endpoints

Linux Endpoints

Managed Agents

Events Ingested (last 24 hours)

Authentication Method (Critical Change)

Replaced token-based authentication with HTTP Basic Authentication for all Trellix ePO API requests

Trellix ePO requires username:password basic auth on every request

Eliminated token refresh logic that caused intermittent 401 Unauthorized errors

Now uses requests.auth.HTTPBasicAuth directly

Successfully validated against a production ePO server (201 managed hosts)

🐛 Fixed
Dashboard Query Issues

Fixed timechart span=auto errors

All queries now use span=1h for stability and compatibility

Corrected field name mismatches

Updated all searches to use native ePO fields:

EPOComputerProperties.ComputerName (hostname)

EPOComputerProperties.IPAddress (IP address)

EPOComputerProperties.OSType (operating system)

EPOLeafNode.AgentVersion (agent version)

EPOLeafNode.ManagedState (agent status)

Fixed Agent Status displaying as Unknown

Status is now derived from EPOLeafNode.ManagedState (1 = Managed, 0 = Unmanaged)

Fixed misleading DAT Version visualization

Renamed to Agent Version Distribution

✨ Added
Dashboard Enhancements

Data Source Status panel

Clearly indicates which modular inputs must be enabled for each dashboard section

Section-level notices

Threat Intelligence

Policy Compliance

User Activity

Advanced Analytics
Each section now explains its required data sources

Endpoint Visibility

Added Endpoint Inventory table with:

Hostname

IP address

Operating system

Domain

Logged-in user

Agent version

Last update time

📌 Notes

This release is strongly recommended for all users

Existing credentials remain valid

No data re-indexing required

Splunk restart recommended after upgrade


Subscribe Share

Are you a developer?

As a Splunkbase app developer, you will have access to all Splunk development resources and receive a 10GB license to build an app that will help solve use cases for customers all over the world. Splunkbase has 1000+ apps from Splunk, our partners and our community. Find an app for most any data source and user need, or simply create your own with help from our developer portal.

Follow Us:
Splunk, Splunk>,Turn Data Into Doing, Data-to-Everything, and D2E are trademarks or registered trademarks of Splunk LLC in the United States and other countries. All other brand names,product names,or trademarks belong to their respective owners.