


Fortinet FortiWeb Add-On for Splunk is the technical add-on (TA) developed by Fortinet, Inc. The add-on enables Splunk Enterprise to ingest or map attack, traffic and event logs collected from FortiWeb physical and virtual appliances across domains. The key features include:
Streamlining authentication and access from FortiWeb such as administrator login, user login to Splunk Enterprise Security Access Center.
Mapping FortiWeb threats report into Splunk Enterprise Security Endpoint Malware Center.
Ingesting attack logs, traffic logs and event logs etc.
Please make sure FortiWeb version is 6.2.0 or later.
There are three ways to install the add-on:
Install from Splunk web UI: Manage Apps->Browse more apps->Search keyword "FortiWeb" and find the add-on with Fortinet logo->Click "Install free" button->Click restart splunk service.
Install from file on Splunk web UI: Manage Apps->Install from file->Upload the .tgz file which is downloaded from https://splunkbase.splunk.com/app/4679 ->check the upgrade box-> click restart splunk service.
Install from file on Splunk server CLI interface: Extract the .tgz file->Place the SplunkAddOnForFortiWeb folder under $SPLUNK_HOME/etc/apps-> Restart Splunk service.
Through Splunk Web UI:
Settings -> Data Input -> UDP -> New Local UDP
Port: 514 (Example, can be modified according to your own plan)
leave other parameters as is.
Note: The UDP port, 514 in this example should be opened in firewall for logs to pass through.
Press the button "Next".
Source Type: "Select"
Click on the "Select Source Type" Drop Menu, input "fwb" in the filter, and select the item "fwb_log".
Fortinet FortiWeb Add-On for Splunk will by default automatically extract FortiWeb log data from inputs with sourcetype "fwb_log".
leave other parameters as is.
Press the button "Review".
Make sure everything is correct and press the button "Submit".
config log syslog-policy
edit splunk
config syslog-server-list
edit 1
set server x.x.x.x
set port 514 (Example. Should be the same as in data input of Splunk server)
end
end
config log syslogd
set policy splunk
set status enable
end
Through Splunk Web UI:
Apps -> Search & Reporting
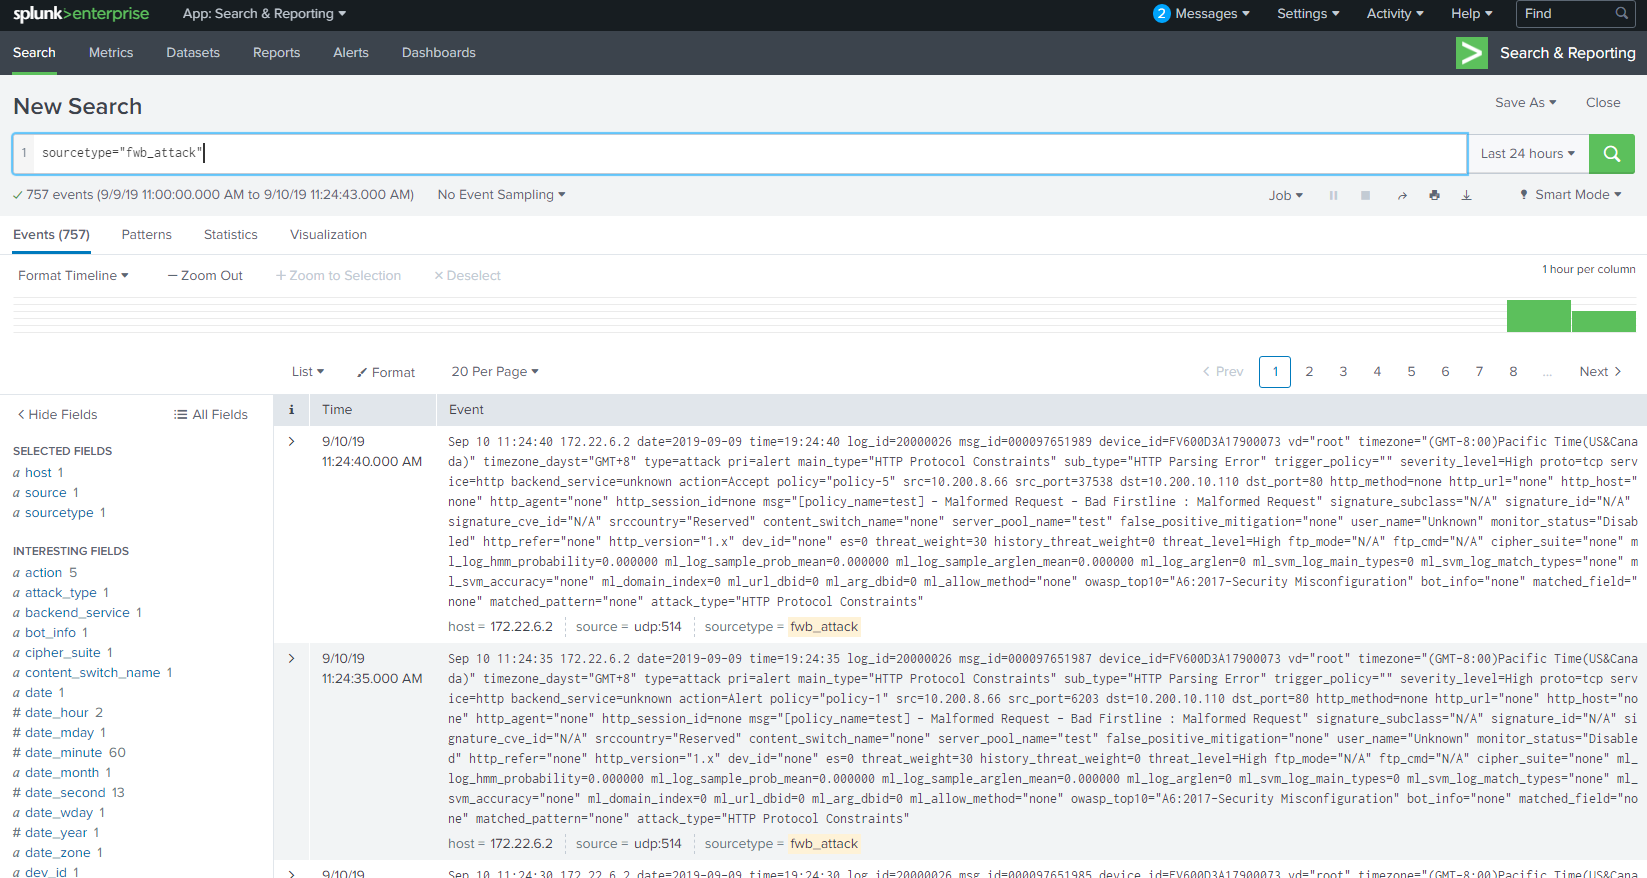
If attack logs have been sent to Splunk, input 'sourcetype="fwb_attack"' in the search window, change the time range if needed.
Then the attack logs will be listed below.
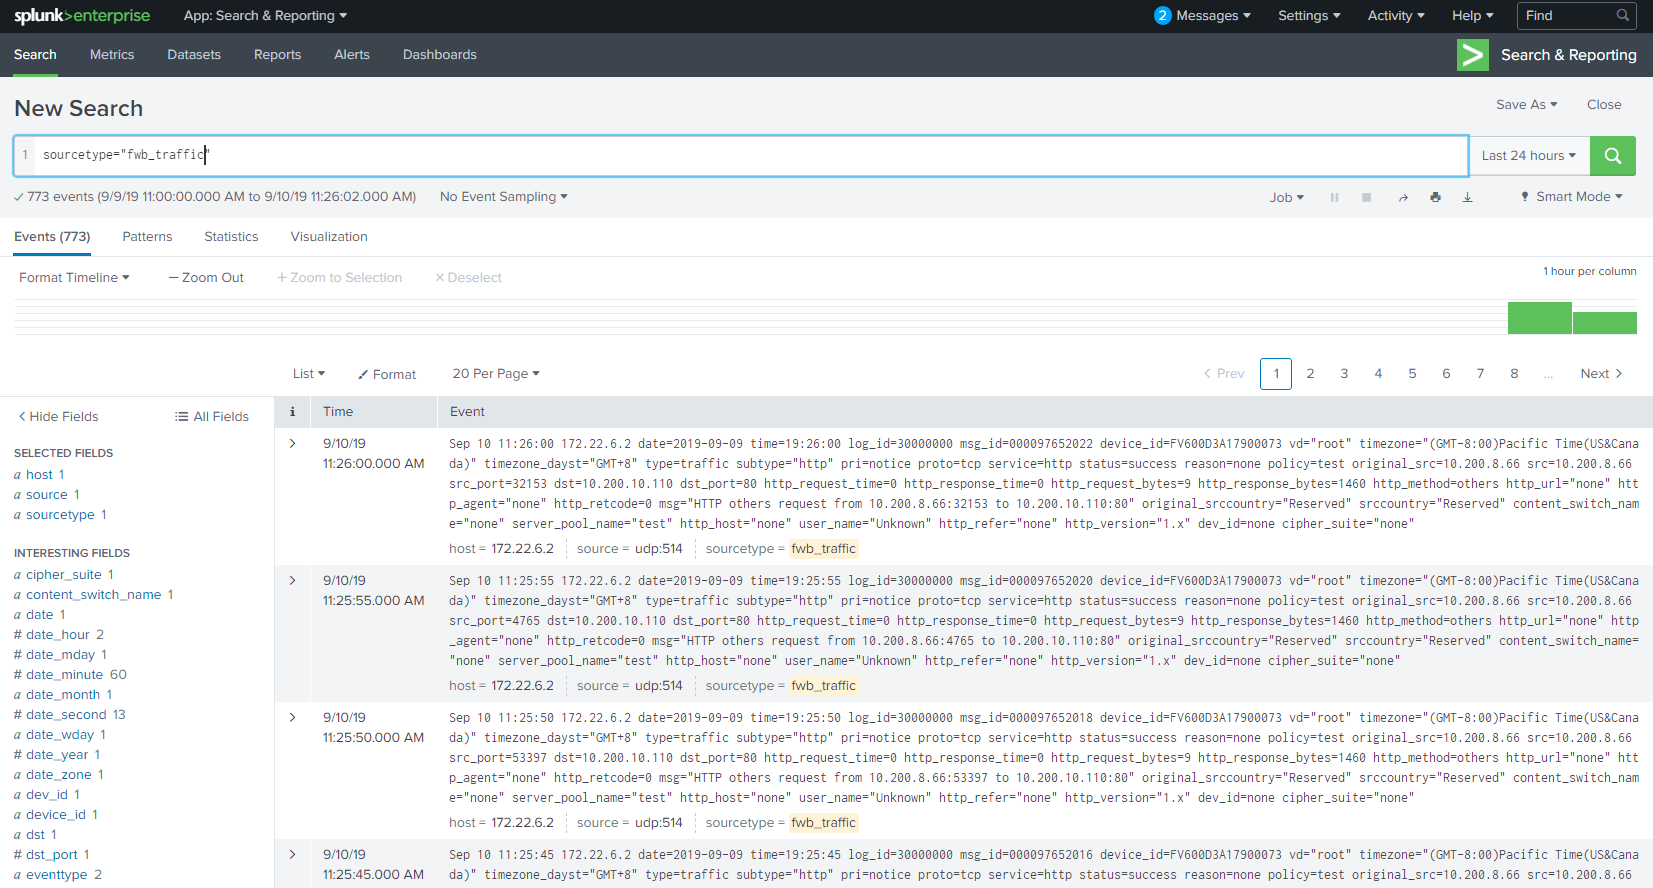
If traffic logs have been sent to Splunk, input 'sourcetype="fwb_traffic"' in the search window, change the time range if needed.
Then the traffic logs will be listed below.
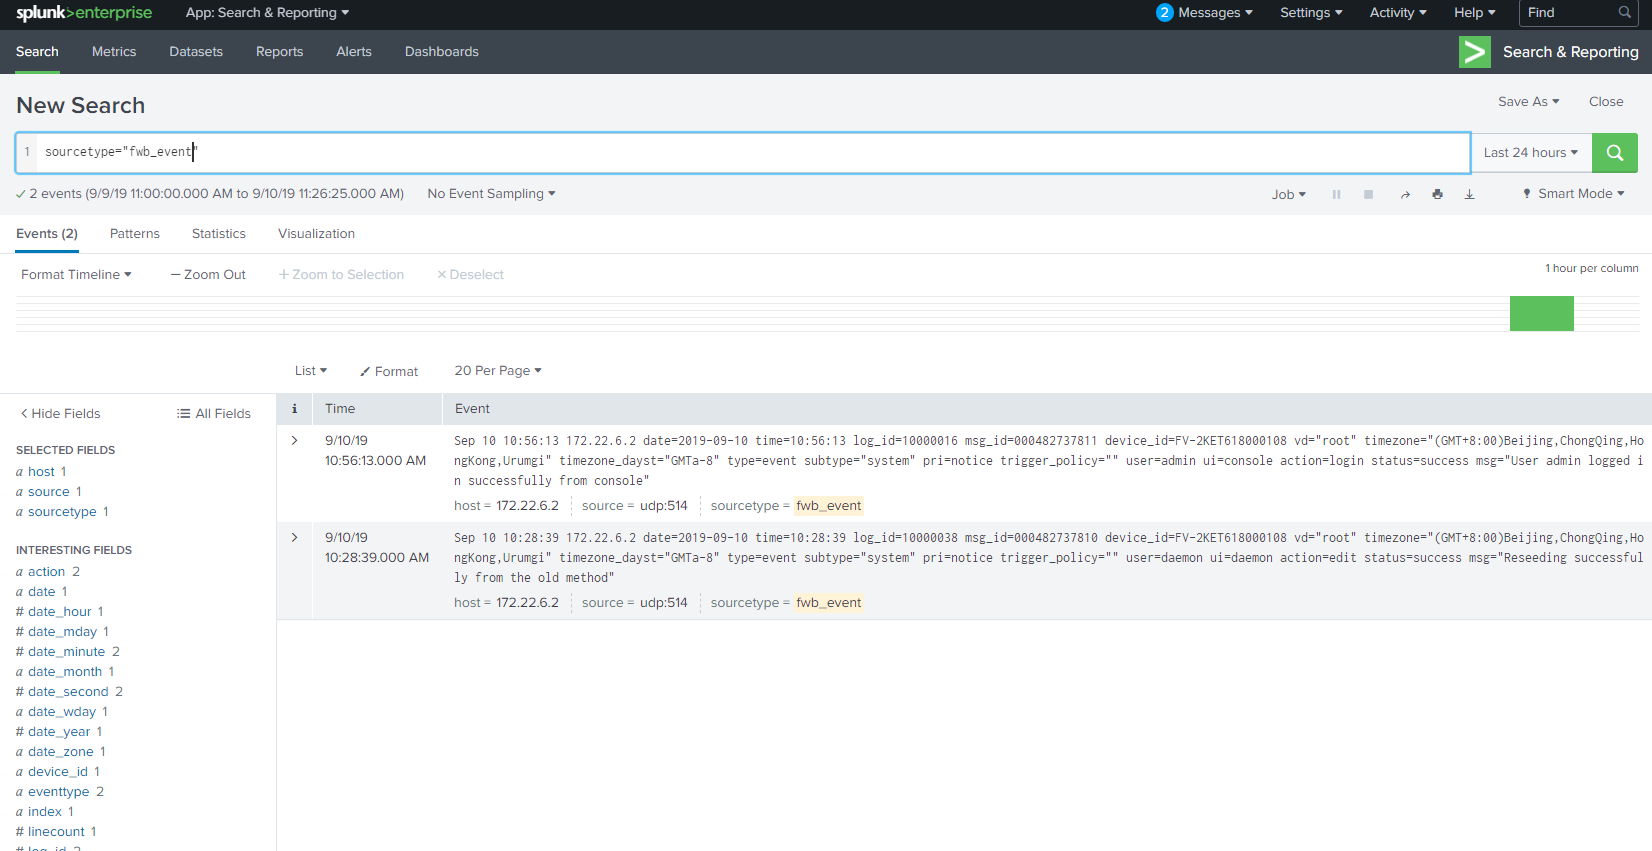
If event logs have been sent to Splunk, input 'sourcetype="fwb_event"' in the search window, change the time range if needed.
Then the event logs will be listed below.
For more information on the App support, email splunk_app@fortinet.com.
As a Splunkbase app developer, you will have access to all Splunk development resources and receive a 10GB license to build an app that will help solve use cases for customers all over the world. Splunkbase has 1000+ apps from Splunk, our partners and our community. Find an app for most any data source and user need, or simply create your own with help from our developer portal.